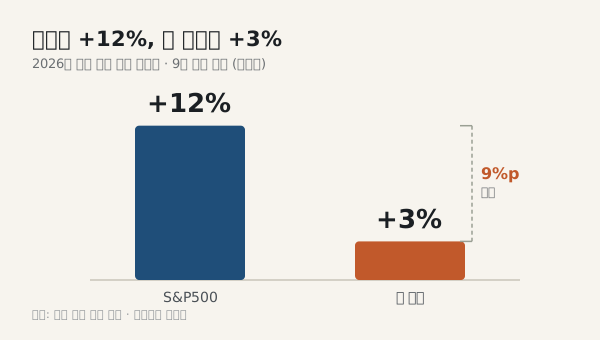
By mid-September, the S&P 500 was up roughly 11-13% year-to-date – lower than the “15-16%” I remembered off the top of my head, but still a solid gain. My own account was the problem. A portfolio loaded with high-risk names like Bitcoin and Enovix (ENVX), plus AI-infrastructure stocks I bought late, in May-June, had gained only 2-3%. I sat down with the data to figure out why the gap between the index and my account had gotten so wide.
1. In 2025, “a handful of stocks did all the work” was actually true
TL;DR: Over half of the index’s 2025 gain came from just seven stocks – the concentration story was real.
In 2025, the S&P 500 returned about 17.9% including dividends (16.4% on price alone). But more than half of that gain – roughly 52% – came from just seven stocks: Nvidia, Alphabet, Microsoft, Broadcom, JPMorgan, Palantir, and Meta. Those seven made up only 25% of the index’s market cap. In fact, only 30.5% of individual S&P 500 stocks beat the index’s return in 2025 – a slight improvement over 2023-2024, but still the fourth-most-concentrated year since 1995.
So through 2025, my working theory – “concentration in a few names makes it hard to keep up with the index” – held up exactly as expected.
2. But in 2026, concentration actually eased
TL;DR: The equal-weight S&P 500 (RSP) pulled ahead of the cap-weighted index (SPY) – concentration wasn’t the problem this time.
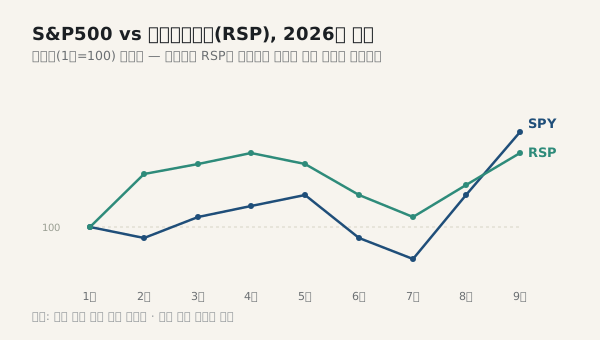
Here’s where things diverged from what I expected. Through 2026, the equal-weight S&P 500 (RSP) repeatedly outran the cap-weighted S&P 500 (SPY). As of April, RSP was ahead of SPY by nearly 5 percentage points; in February, that gap briefly topped 6 percentage points. In other words, “mega-cap tech concentration” actually eased in the first half of 2026. That suggests my underperformance wasn’t caused by concentration getting worse – it was more likely caused by a correction in the very mega-cap names I’d bought late.
So how many stocks are actually beating the index? Rather than guess from a small sample, this is a statistic research desks already track every year: the share of individual S&P 500 constituents that outperform the index itself. First Trust Portfolios’ running series shows it climbing sharply – 26.9% in 2023, 27.7% in 2024, 30.5% in 2025, and 46% in the first half of 2026 alone, with some 2026 snapshots running as high as the high-50s to low-60s percent, a level of participation not seen in close to a decade. So the concentration story from Section 1 really has been unwinding in 2026: a clear majority-trending share of individual stocks are now keeping pace with or beating the index, not just a handful of mega-caps.
Two names from this site’s own tracked list illustrate the shift concretely: Apple (AAPL) lagged the index in 2025 (+8.6% vs. the index’s +18.0%) but is beating it in 2026 (+20.1% vs. +11.1% YTD as of 9/10), while Alphabet (GOOGL/GOOG) – one of 2025’s strongest Magnificent Seven names (+66.0% / +64.8%) – has fallen behind in 2026 (+7.8% / +6.4%), exactly the “correction in the leaders themselves” pattern this post pointed to above.
Which sectors are actually driving that broadening? The clearest, most quantifiable case is energy: it was one of 2025’s laggard sectors at +7.9%, well behind the index’s +16.4%, but it’s 2026’s best-performing sector by far, up somewhere in the 40%s year-to-date – largely the same Iran-war oil spike covered in Section 4 below, not a coincidence. Materials, industrials, financials, and healthcare have also picked up relative strength alongside energy.
One plausible-sounding theory the data does not support: several “2026 outlook” pieces published in late 2025 predicted a rebound in beaten-down consumer discretionary names like Nike. That hasn’t happened – Nike (NKE) is down another -38.6% YTD in 2026 on top of 2025’s -13.8%, one of the worst runs of any S&P 500 stock this year. Walmart (WMT), despite a strong 2025 (+24.5%), is roughly flat to slightly negative in 2026 – also lagging the index. Consumer discretionary as a sector was actually downgraded to underperform for the second half of 2026 by several analysts. The broadening that did happen ran through energy, industrials, and materials, not the “unloved retail bounces back” story that looked plausible heading into the year.
In fact, the Philadelphia Semiconductor Index (SOX) dropped 20.6% in July alone. Big Tech’s (Microsoft, Alphabet, Amazon, Meta) consensus AI capex estimate more than doubled in a year, from $330 billion to $714 billion – but over the same period, capex as a share of EBITDA jumped from 52% to 86%, and the market started questioning whether that spending was translating into cash flow. That’s the backdrop for why the AI-infrastructure names I bought near their May-June highs went on to chop sideways and correct.
3. Bitcoin and ENVX: a double dose of risk-asset pain
TL;DR: Bitcoin’s volatility and ENVX’s leadership crisis hit at the same time.
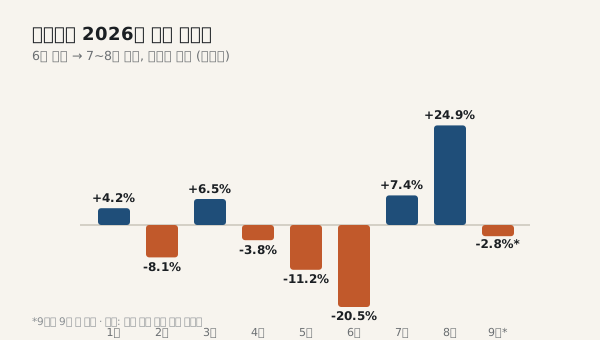
Bitcoin finished 2025 down -6.3%, and as of early September 2026 it was down -9.6% year-to-date (swinging -20.5% in June, +7.4% in July, and +24.9% in August – volatility with little net progress). In 2025 there was at least a sense that rates and liquidity were supportive; in 2026, that tailwind reversed.
ENVX was harsher still. Its CEO abruptly resigned on August 13, and the stock dropped 18% in a single day; by August 18 it hit an all-time low of $3.06. Revenue is growing (up 21% in Q2), but as a still-unprofitable “story stock,” a single leadership shock was enough to shake the share price hard.
4. Two shadows: the Iran war and the midterms
TL;DR: Despite the double bind of high oil prices and high rates, the index held up on the strength of AI mega-caps.
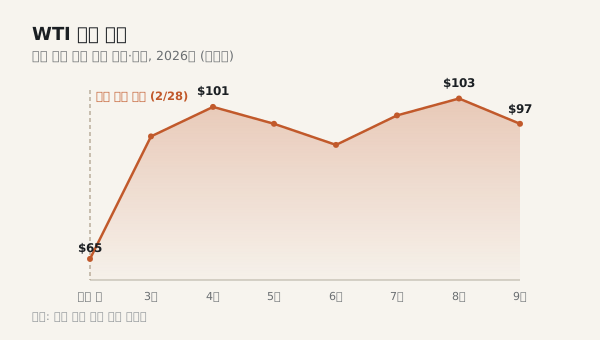
Since the U.S.-Israeli strikes on Iran on February 28 kicked off the war, WTI crude has swung between $65 and over $100 a barrel, and it’s stayed elevated for more than seven months. Against that backdrop of high oil prices and a 10-year Treasury yield around 4.85% – the highest since November 2023 – the Trump administration, heading into November midterms, has floated permanent tax cuts and a cash dividend ($5,000 per person) to prop up markets and public sentiment.
So far, though, that stimulus has been fighting an uphill battle against a “triple headwind” of high oil, high rates, and tariff conflict, without a clear payoff yet. The fact that SPY still managed a double-digit return looks, from the data, less like a result of stimulus and more like the strength of large AI-related stocks plus the market’s now-familiar pattern of shrugging off war shocks two to four weeks after they hit.
Conclusion: the real reason my account lagged
Pulling it together, my account’s weak 2026 wasn’t caused by “worsening concentration” – it was caused by the fact that the specific assets I happened to hold (Bitcoin, high-risk growth names, and AI-infrastructure stocks bought near their May-June highs) all corrected around the same time. The index is still propped up by a handful of mega-caps, but the surprising thing the data shows is that in the first half of 2026, that concentration was actually easing, not worsening.
This post is based on publicly available market data as of September 12, 2026, and is not investment advice.
Sources used in this post: S&P Dow Jones Indices (S&P 500 index and constituent contribution data); First Trust Portfolios, “S&P 500 Index 1H Update: The Broadening Continues” (July 9, 2026) for the 2023-2026 breadth statistics; Invesco RSP (equal-weight S&P 500 ETF) price data; CoinGecko / CoinMarketCap (Bitcoin monthly price data); U.S. Energy Information Administration (EIA, WTI spot price data); Federal Reserve Bank of St. Louis (FRED, 10-year Treasury yield); Enovix Corporation disclosures and press releases; Philadelphia Semiconductor Index (SOX) closing price data; Investing Daily, “The Energy Sector in 2025” and Investing.com, “S&P 500 sector performance: Energy leads” for 2025-2026 energy-sector returns; FinanceCharts.com for Nike and Walmart total-return data; this site’s own tracked daily price history (Alpha Vantage) for the Apple/Alphabet return figures. These are general references for the figures cited rather than a formal citation list – verify and link the exact sources before republishing elsewhere.
9월 중순, S&P500을 확인해보니 연초 대비 약 11~13% 올라있었다. 내 기억 속 “15~16%”보다는 낮은 숫자였지만, 그래도 준수한 상승이다. 문제는 내 계좌였다. 비트코인과 Enovix(ENVX) 같은 고위험 종목, 그리고 5~6월에 뒤늦게 들어간 AI 인프라 관련주로 채운 포트폴리오는 겨우 2~3% 오르는 데 그쳤다. 지수와 내 계좌 사이에 왜 이렇게 큰 틈이 생겼는지, 데이터를 붙잡고 따져봤다.
1. 2025년: “소수 종목 독식”은 사실이었다
TL;DR 2025년 지수 상승분의 절반 이상이 상위 7개 종목에서 나왔다 — 쏠림은 실재했다.
2025년 S&P500은 배당 포함 총수익률 약 17.9%(가격 기준 16.4%)를 기록했다. 그런데 이 상승분의 절반 이상(약 52%)이 상위 7개 종목 — 엔비디아, 알파벳, 마이크로소프트, 브로드컴, JP모건, 팔란티어, 메타 — 에서 나왔다. 이들의 시가총액 비중은 지수의 25%에 불과했는데도 그렇다. 실제로 2025년에 지수 수익률을 웃돈 개별 종목은 전체의 30.5%뿐이었다. 2023~2024년보다는 약간 나아졌지만, 여전히 1995년 이후 네 번째로 편중이 심한 해였다.
즉 2025년까지는 “소수 종목 쏠림 → 지수 따라가기 어려움”이라는 내 가설이 정확히 맞아떨어졌다.
2. 그런데 2026년엔 오히려 쏠림이 풀리고 있었다
TL;DR 동일가중지수(RSP)가 시총가중지수(SPY)를 앞서며 쏠림이 완화됐다 — 문제는 다른 데 있었다.
여기서 예상과 다른 부분이 나온다. 2026년 들어 동일가중 S&P500(RSP)이 오히려 시가총액가중 S&P500(SPY)을 앞서는 흐름이 여러 차례 관측됐다. 4월 기준으로는 RSP가 SPY를 5%p 가까이 웃돌았고, 2월에는 그 격차가 한때 6%p를 넘기도 했다. 이는 “대형 기술주 쏠림”이 2026년 상반기엔 오히려 완화됐다는 뜻이다. AI 대장주에 뒤늦게 올라탄 내 포지션이 부진했던 이유가, “쏠림 심화” 때문이 아니라 오히려 “쏠림 종목 자체의 조정” 때문이었을 가능성이 크다는 얘기다.
그래서 실제로 지수를 상회하는 종목이 몇 개나 될까. 표본이 작은 데이터로 추측하기보다, 이건 리서치 업계가 매년 실제로 추적하는 통계다 — S&P500 개별 종목 중 지수 자체를 상회한 비중. First Trust Portfolios의 추적 시리즈를 보면 이 비중이 뚜렷하게 늘고 있다 — 2023년 26.9%, 2024년 27.7%, 2025년 30.5%, 그리고 2026년 상반기만 놓고 보면 46%까지 올라왔고, 2026년 특정 시점에는 50%대 후반~60%대 초반까지 찍은 적도 있다 — 거의 10년 만에 보는 수준의 참여율이다. 즉 1번 섹션에서 말한 “소수 종목 쏠림”이 2026년 들어 실제로 풀리고 있다는 뜻이다 — 극소수 대형주가 아니라, 과반에 가까운 개별 종목들이 지수와 비슷하거나 더 나은 성과를 내고 있다.
이 사이트가 추적하는 종목 중에서도 이 흐름을 보여주는 사례가 있다. 애플(AAPL)은 2025년엔 지수를 하회했지만(+8.6% vs 지수 +18.0%), 2026년엔 지수를 상회하고 있다(+20.1% vs 9/10 기준 지수 +11.1%). 반대로 알파벳(GOOGL/GOOG)은 2025년 매그니피센트7 중에서도 가장 강했던 종목(+66.0%/+64.8%)이었지만, 2026년엔 오히려 지수를 하회한다(+7.8%/+6.4%) — 앞서 말한 “쏠림 종목 자체의 조정” 패턴을 정확히 보여주는 사례다.
그럼 구체적으로 어떤 섹터가 이 확대를 이끌었을까. 가장 명확하고 수치로 확인되는 사례는 에너지다. 에너지는 2025년엔 소외 섹터였지만(+7.9%, 지수의 +16.4%에 크게 못 미침), 2026년엔 단연 최고 성과 섹터로 올라섰다(연초 대비 40%대 상승) — 뒤에 4번 섹션에서 다룰 이란 전쟁발 유가 급등이 바로 그 배경이니, 우연이 아니다. 소재(Materials)·산업재·금융·헬스케어 섹터도 함께 상대적 강세를 보였다.
다만 그럴듯하게 들리지만 데이터로는 확인되지 않는 이야기도 있다. 2025년 말에 나온 여러 “2026년 전망” 글들은 나이키처럼 그동안 눌려있던 경기소비재(consumer discretionary) 종목의 반등을 예상했었는데, 실제로는 그렇게 되지 않았다. 나이키(NKE)는 2026년에도 -38.6% 더 빠졌고(2025년 -13.8%에 이어), 올해 S&P500 종목 중 최악의 흐름 중 하나였다. 월마트(WMT)도 2025년엔 강했지만(+24.5%), 2026년엔 보합~소폭 마이너스로 지수를 하회하고 있다. 실제로 경기소비재 섹터는 여러 애널리스트들이 2026년 하반기 “언더퍼폼”으로 등급을 낮추기도 했다. 즉 2026년에 실제로 일어난 확산은 에너지·산업재·소재 쪽이었지, 연초에 그럴듯해 보였던 “눌려있던 소매주 반등” 스토리는 아니었다.
실제로 7월 한 달간 필라델피아 반도체지수(SOX)는 20.6% 급락했다. 빅테크(마이크로소프트·알파벳·아마존·메타)의 AI 설비투자 컨센서스는 1년 만에 3,300억 달러에서 7,140억 달러로 두 배 넘게 불었지만, 같은 기간 EBITDA 대비 자본지출 비중은 52%에서 86%로 치솟으며 “투자 대비 현금흐름”에 대한 의구심이 시장을 짓눌렀다. 내가 5~6월 고점 부근에서 들어간 AI 인프라주들이 이후 횡보·조정을 겪은 배경이 여기에 있다.
3. 비트코인과 ENVX: 리스크 자산의 이중고
TL;DR 비트코인의 변동성 장세와 ENVX의 리더십 리스크가 같은 시기에 겹쳤다.
비트코인은 2025년 한 해 -6.3%로 마감했고, 2026년에도 9월 초 기준 연초 대비 -9.6%를 기록 중이다(6월 -20.5%, 7월 +7.4%, 8월 +24.9%로 널뛰기하며 변동성만 키웠다). 2025년엔 그나마 금리·유동성 환경이 우호적이었다는 인식이 있었지만 2026년엔 그 흐름이 꺾인 셈이다.
ENVX는 더 가혹했다. 8월 13일 CEO가 전격 사임하며 주가가 하루 만에 18% 급락했고, 8월 18일에는 역대 최저가(3.06달러)를 찍었다. 매출은 늘고 있지만(2분기 매출 21% 증가) 여전히 적자가 이어지는 ‘스토리주’인 만큼, 리더십 리스크 하나에도 주가가 크게 흔들렸다.
4. 이란 전쟁과 중간선거, 두 개의 그림자
TL;DR 고유가·고금리 이중고 속에서도 지수는 AI 대형주의 저력으로 버텼다.
2월 28일 미국·이스라엘의 이란 공습으로 전쟁이 시작된 이후, WTI 유가는 배럴당 65달러에서 100달러를 넘나들었고 7개월 넘게 이어지고 있다. 고유가와 미 국채 10년물 금리 4.85%대(2023년 11월 이후 최고 수준)라는 이중고 속에서, 11월 중간선거를 앞둔 트럼프 행정부는 감세 영구화와 현금 배당(1인당 5,000달러) 공약까지 꺼내 들며 증시·민심 부양에 안간힘을 쓰고 있다.
다만 아직까지는 고유가·고금리·관세전쟁이라는 ‘삼중 악재’에 밀려, 이 부양책이 뚜렷한 성과로 이어졌다고 보기는 어려운 상황이다. SPY가 그나마 두 자릿수 수익률을 지킨 건 부양책의 힘이라기보다, AI 관련 대형주의 저력과 시장의 학습된 회복탄력성(전쟁 발발 2~4주 후 영향력이 둔화되는 패턴) 덕이 컸다고 보는 편이 데이터에 더 부합한다.
결론: 내 계좌가 부진했던 진짜 이유
정리하면, 2026년 내 계좌 부진의 원인은 “쏠림이 심해져서”가 아니라 하필 내가 편입한 자산군(비트코인, 고위험 성장주, 5~6월 고점 매수 AI 인프라주)이 공교롭게 동시에 조정을 받은 시기와 겹쳤기 때문이다. 지수는 여전히 소수 대형주가 떠받치고 있지만, 2026년 상반기엔 오히려 그 쏠림이 완화되는 국면이었다는 게 데이터가 보여주는 의외의 사실이었다.
이 글은 2026년 9월 12일 기준 공개된 시장 데이터를 바탕으로 작성되었으며, 투자 조언이 아닙니다.
이 글에서 사용한 주요 출처: S&P Dow Jones Indices(S&P500 지수 및 종목별 기여도 데이터); First Trust Portfolios, “S&P 500 Index 1H Update: The Broadening Continues”(2026년 7월 9일) — 2023~2026년 종목별 지수 상회 비중 통계 출처; Invesco RSP(동일가중 S&P500 ETF) 가격 데이터; CoinGecko / CoinMarketCap(비트코인 월별 가격 데이터); 미 에너지정보청(EIA, WTI 현물가격 데이터); 세인트루이스 연방준비은행(FRED, 미 국채 10년물 금리); Enovix Corporation 공시자료 및 보도자료; 필라델피아 반도체지수(SOX) 종가 데이터; Investing Daily “The Energy Sector in 2025” 및 Investing.com “S&P 500 sector performance: Energy leads”(2025~2026년 에너지 섹터 수익률); FinanceCharts.com(나이키·월마트 토탈리턴 데이터); 애플·알파벳 수익률은 이 사이트가 자체 추적 중인 일별 시세 데이터(Alpha Vantage 기반)를 직접 계산한 것. 위 출처는 인용 수치의 일반적 출처를 밝힌 것이며, 다른 곳에 다시 게시하기 전에 정확한 링크를 직접 확인해 추가하는 것을 권장합니다.
Comments 댓글